The Sales Report can be found in the Report tab at the top of the Report List.
The report is broken into three tabs, Overview, Revenue sources, and Revenue channels.
Overview
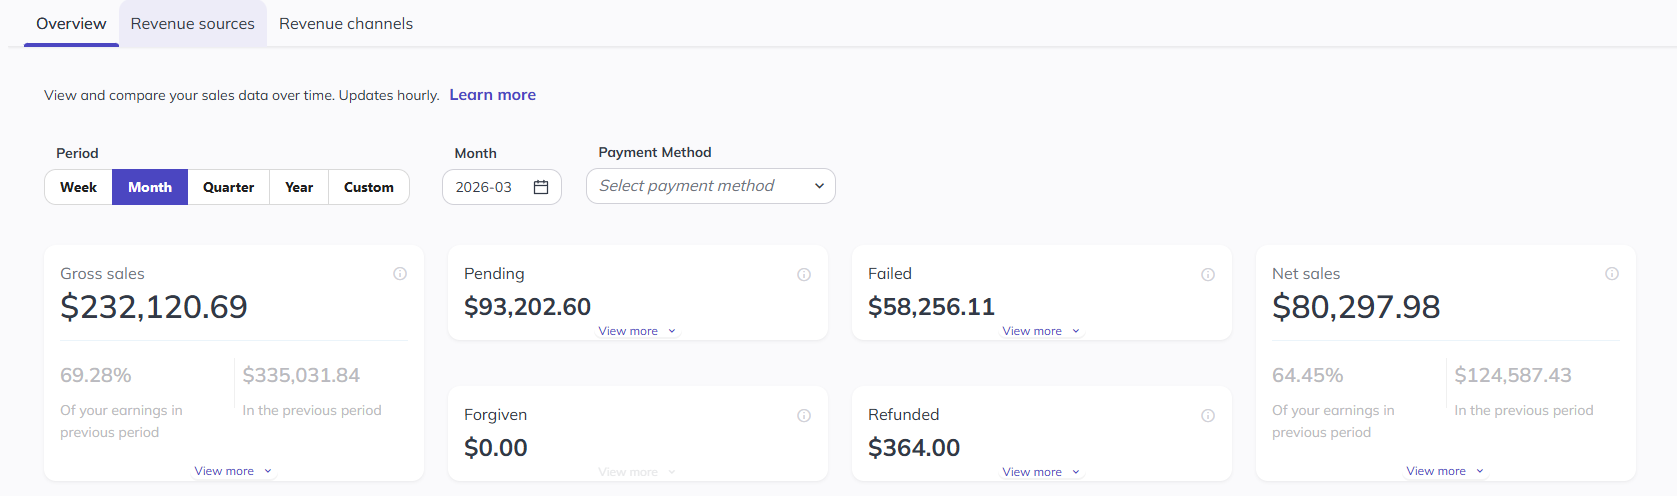
The first part of the Overview section shows you your overall figure for the selected time period.
- Gross Sales - The total value of sales made during the period without adjusting for any costs related to such sales. Includes "Pending transactions".
- Failed Payments - Total value of Failed payments
- Pending Payments - Total amount of payment currently pending
- Forgiving Payments - Total value of payments forgiven
- Refunds - Total value of refunds during that period
- Net Sales - Gross sales minus failed or refunded sales.
Subsequently, the Overview section includes a graphical representation illustrating Net Sales across the chosen timeframe. You can customisable the visualisation using the date filters available.
Revenue Sources
Sales by Revenue Stream
In the Revenue sources section, you will see sales by revenue stream, which will show you a break down of what your members are spending money on and where payments are failing or being refunded.
This is broken down by:
- Memberships/ Credit Packs & Add Ons
- Classes Courses, Appointments
- Products, Custom Charges, and Fees
Below the snapshot is a table of all revenue streams, followed by a bar chart showing a visual of revenue streams:
Net Sales by Membership
This report will show you the net amount earned per membership in the period.
Net Sales - Recurring vs Non-Recurring, Upfront Fees, Maintenance Fees, No-show Fees, Late Cancel Fees
Finally, there is a series of tables showing the revenue from the various types of fees that can be charged. Clicking 'View more' under each snapshot will open the table, and these tables can all be downloaded.
Revenue Channels
The Revenue channels tab shows how your revenue is sold, paid for, and processed.
Sales by payment method
This section shows a bar chart and table report on all sales broken down by payment method.
Below that, there are three tables showing a breakdown of sales by Lead source, Lead entry point, and Registration point.
Please Note:
- The Sales Report undergoes updates on an hourly basis.